Research Technology -- X Marks the Spot
By Hugh Ashton
Some innovative software is helping companies take the guesswork out of patent research.
“Making the intangible tangible” Tatsuo Nakamura, CEO and co-founder of SO-TI, Inc. likes to use this phrase to describe his company’s unique product. Users navigating the patent jungle, composed of literally millions of patent filings, are often at a loss to know where to start. To assist them, SO-TI’s first product series, XLUS (pronounced “Kai-lus”), provides a visualization of relevant parts of the Japan Patent Office database, using natural language queries to discover and display the relationship of patents to each other. XLUS comes in two varieties: Green (high-speed mapping of the patent space), and White (mapping, together with searching, of full  SO-TI Inc CEO and co-founder Tatsuo Nakamura. -- Photography by Hiromi Iguchi.patent data and creation of a full data set for further analysis), allowing searches of Japanese patents. In 2008, the XLUS Eagle series (also in green and white colors) was unveiled for use with US patent data from the US Patent and Trademark Office.
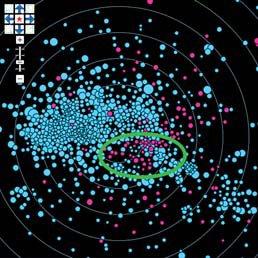
After the query is submitted, SO-TI’s server farm performs the search and analysis, and within a few seconds the searcher’s Web browser shows relationships as a radar chart, with the original search term in the center. Patents with similar content are arranged in positions around the original, with their distance from the center indicating their similarity to the original, and the angle at which they are displayed also indicates the nature of the content (this is, patents with content similar to each other will be displayed at the same “o’clock” relative to the original). As well as these angular and radial dimensions, the map provides two other visual metrics. The first is color —the names of the holders of the mapped patents are given to the right of the map, and clicking on these names highlights the holders’ patents on the map, with a different color assigned to each holder. Lastly, the size of the markers on the map can indicate “patent clusters” of very similar patents.
Highlighting and selecting a marker naturally brings up references and a fuller description of the patent for further review and analysis, and the selected patent can then be used as the starting point for a new search.
Though patent search engines are not new, most demand a specialist knowledge of the field being researched and/or patent terminology. XLUS makes such searches easy for lay users, by accepting natural language text input (even including news reports), or one or more patent numbers as starting points for exploration and research.
Why a map?
Rather than calling XLUS a “search engine,” Nakamura prefers to use the term “research engine” to describe the software. Much more than a simple Google-like list of results, XLUS’s maps put any given patent into context, highlighting the areas where similar research has been carried out, and the authors of such research.
 The plot of two different companies’ patents, one in pink and one in blue. Note the circled area where the “pink company” holds patents in area where the “blue company” has yet to venture.
A reader may interpret the map and look for gaps and overlaps to gain a bird’seye view of the relevant industry, with an instant understanding of the current industry trends, including time-based trends if time is used as a search factor.
The unique URL displaying the chart on the browser may be sent to others within the searcher’s organization as a “read-only” summary of the results, even if the recipient does not have a license to use the XLUS service.
All these features make XLUS useful to a wide variety of users; not merely the obvious candidates, such as IP specialists in manufacturing companies wishing to avoid litigation, but also to R&D engineers seeking to understand competitors’ thinking as shown by patent registrations, and patent lawyers presenting clients’ claims in an easy-to-understand form to non-technical juries. Industry consultants and analysts can also visualize trends and movements in their specialties as shown by the “patent trail”. Already over 50 organizations are discovering the value of being able to visualize the patent space in this way.
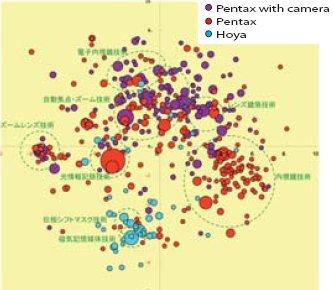
The financial sector, too, is a potential home for XLUS. An entity considering a loan to a company against IP offered as collateral should mitigate credit risk through accurate valuation of that collateral. If a company’s patent portfolio occupies an otherwise empty gap in the patent space, it is a fair bet that this portfolio is valuable. This also applies, naturally, to the  Note the synergies and overlaps between these two potential M&A partners and the distinctions to be drawn between the research goals of the different arms of one of these partners.M&A world, where the synergies and overlaps between two prospective enterprises can be visualized and evaluated quicker and easier than by any other method, with XLUS providing foreign companies wishing to examine the worth of potential Japanese partners with a unique risk-avoidance tool.
Back-office analysts rating companies for the purposes of equity or bond deals will also find XLUS a valuable tool. The annual cost of using the XLUS service equates to only a few days of conventional specialists’ time, and XLUS can, claims Nakamura, produce far more meaningful and detailed results in a fraction of the time than can its human “competitors”.
So convinced are Nakamura and cofounder Yoshio Takaeda of the utility of XLUS outside Japan that they have recently opened an office in the heart of Silicon Valley to introduce XLUS to the US, and have plans to speed up the service for US customers by installing a US-based server farm, allowing easy exploration of the vast field of US patents. In addition, a future version of XLUS will expand the scope of patent exploration to EPO (Europe) and WIPO (global). A beta version of the engine modified to explore and analyze research papers is also currently undergoing testing, expanding the scope of the service and making it even more valuable.
Why is it pronounced “Kai-lus”?
The X in XLUS is pronounced as “kai” for a number of reasons. First, the Greek letter X, pronounced “kai”) is used in statistics in chi-squared tests to determine differences in distributions. Next, the syllable “kai” in Japanese written as 解 means “solution”. And finally, the syllable “kai” written as 快 can also mean “pleasant” or “comfortable.”
SO-TI, Inc.
4-8-6, Roppongi, Minato-ku,
Tokyo, 106-0032, Japan
111 N Market Street, 6th Floor,
San Jose, CA 95113 USA
Tel: +81-3-6231-9215
Fax: +81-3-6231-7908


